
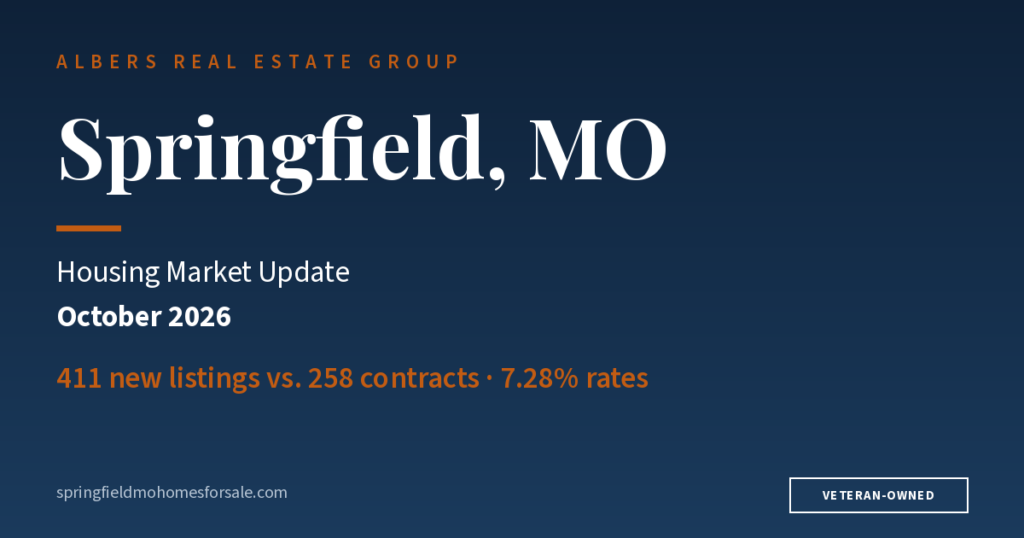
In the Springfield, MO housing market, sellers are listing homes faster than buyers are signing contracts, and mortgage rates just crossed 7%. In September 2026, 411 new homes hit the market inside Springfield city limits while 258 went under contract, about 1.6 new listings for every accepted offer.
At the same time, the 30-year fixed mortgage rate averaged 7.28% nationally as of October 1, 2026, according to Freddie Mac. That is up from 6.71% on September 3 and 6.34% a year ago. If you are thinking about selling a home in Springfield or anywhere in Greene County this fall, here is what the local MLS numbers say, and why pricing for top dollar is a different game at 7% than it was at 6%.
Springfield sellers are outpacing buyers
Over the past 12 months, 1,439 more homes came on the Springfield market than went under contract. That happened in every single month, including September 2026, when 411 new listings met just 258 new contracts.
Springfield: new listings vs. new contracts
Show the data as a table
| Month | New listings | New contracts | Difference |
|---|---|---|---|
| Oct 2025 | 447 | 308 | 139 |
| Nov 2025 | 308 | 244 | 64 |
| Dec 2025 | 269 | 202 | 67 |
| Jan 2026 | 328 | 263 | 65 |
| Feb 2026 | 353 | 283 | 70 |
| Mar 2026 | 484 | 336 | 148 |
| Apr 2026 | 513 | 369 | 144 |
| May 2026 | 589 | 345 | 244 |
| Jun 2026 | 433 | 314 | 119 |
| Jul 2026 | 396 | 284 | 112 |
| Aug 2026 | 401 | 287 | 114 |
| Sep 2026 | 411 | 258 | 153 |
Some of that gap is normal, since listings that expire or get pulled are counted too. The ratio was about the same a year earlier. What it means: every seller is competing with more new listings than there are new buyers each month.
Asking prices are running ahead of selling prices
The bigger warning sign is price. Springfield asking prices rose faster than selling prices over the past year, and the gap between them grew to $72,800.
| Springfield, MO residential | Sep 2025 | Sep 2026 | Change |
|---|---|---|---|
| Median asking price, active listings | $298,750 | $327,000 | +9.5% |
| Median sold price | $239,000 | $254,200 | +6.4% |
| Gap between asking and sold | $59,750 | $72,800 | +$13,050 |
Active listings include homes that have not sold yet, often because they are priced above what buyers are paying. Buyers are paying around $254,000 for the typical Springfield home; many sellers are asking far more.
What 7.28% mortgage rates do to a Springfield buyer’s budget
At 7.28%, the same monthly payment buys about 9% less house than it did at 6.34% a year ago. On a Springfield median-priced home, that is roughly $23,000 of buying power gone.
| Example: $254,200 home, 20% down | Rate 6.34% (Oct 2025) | Rate 7.28% (Oct 1, 2026) |
|---|---|---|
| Loan amount | $203,360 | $203,360 |
| Monthly principal + interest | $1,264 | $1,391 |
| Price the $1,264 payment now buys | $254,200 | about $230,900 |
This is illustrative math only: principal and interest on a 30-year fixed loan, using Freddie Mac’s national average rates. It leaves out taxes, insurance and mortgage insurance, and it is not a loan quote. Actual rates depend on credit, loan type and lender, so buyers should get their numbers from a licensed lender.
What it means for sellers: most buyers shop by monthly payment, not list price. When rates jump almost a full point, the buyer who could afford your home last fall may now be shopping $20,000 to $25,000 lower.
The other side: well-priced Springfield homes still sell
This is not a crash, and it is not a flood of listings. Springfield active inventory was 712 homes in September 2026, down 14% from 828 a year earlier and down from its 2026 peak of 909 in May.
- Months of supply: 2.52 in September 2026, still a tight market by most measures
- Contracts held steady: 258 pending sales in September 2026, the same as September 2025
- Average days on market: 34.2 days (42.5 counting relists), close to last year’s 34.7 and 46.2
- Homes that sold got 98.3% of their final list price on average
The catch is the gap between those last two numbers. Sellers averaged 98.3% of the final price but only 96.6% of the original asking price. On a $254,200 home, selling 3.4% below the original asking price is about $8,600 given up, usually after a price cut and extra weeks on the market. Much of September’s buying also happened before rates crossed 7% on September 24, so October and November will show the real effect of the jump.
What Springfield sellers should do this fall
Price to the homes that sold, not the homes that are sitting. September’s sold median was $254,200; the active median asking price was $327,000.
- Ask for a market analysis built on closed sales from the last 90 days near your home, not on active listings.
- Price for the buyer’s payment at today’s rates, not last year’s.
- Fix what inspectors will find before you list; buyers with tight budgets have little room for repairs.
- Plan for negotiation. Sellers averaged 96.6% of original list price in September.
- Watch your first two weeks. Showings and feedback in that window tell you whether the price is right.
Moving to Springfield, MO?
For buyers relocating to Southwest Missouri, the same numbers cut the other way. You have more homes to pick from than contracts being written, and sellers of homes that sit often negotiate. Get pre-approved first, since a 7% rate makes your real budget matter more than ever.
Springfield MO housing market FAQ
Is Springfield, MO a buyer’s or seller’s market right now?
Neither, cleanly. Supply is tight at about 2.5 months, but new listings outpaced new contracts every month for the past year and overpriced homes are taking cuts.
What is the median home price in Springfield, MO?
The median sold price inside Springfield city limits was $254,200 in September 2026, up 6.4% from $239,000 in September 2025.
How long does it take to sell a house in Springfield, MO?
Homes that sold in September 2026 averaged 34.2 days on market, or 42.5 days when relisted homes are counted from their first listing.
Do higher mortgage rates lower home prices in Springfield?
Not automatically. They lower what buyers can pay each month, which puts pressure on homes priced above recent sales.
Related: What’s Actually Selling in the Springfield, MO Area Right Now
Sources and method
- MLS data: Southern Missouri Regional MLS via Flexmls, residential property, Springfield city limits, monthly statistics pulled October 2, 2026. Data deemed reliable but not guaranteed.
- Mortgage rates: Freddie Mac Primary Mortgage Market Survey, national averages for conventional loans with 20% down and excellent credit.
- Payment examples are principal and interest only, for illustration, and are not a loan offer or financial advice.