
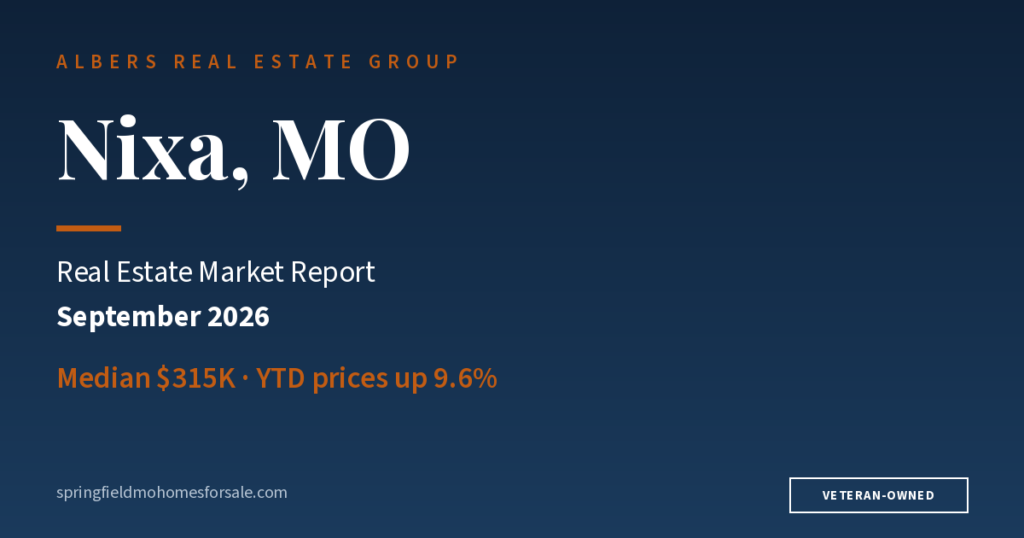
Nixa homes sold much faster in September 2026 than a year ago. The median home went under contract in 23.5 days, down from 42. Closings fell 11.9% to 52 at a median of $315,000, and new listings jumped to 108 from 65.
Here is what the jump in new listings means, and why Nixa still has the strongest price growth of the year.
Absorption rate: 2.60 months. Nixa has 2.60 months of supply at the current sales pace. Under 6 months is generally a seller’s market; under 3 months is strong seller territory.
Faster sales, fewer closings, a wave of new listings
Nixa closed 52 priced sales in September against 59 a year ago, but sold them far faster: 23.5 days of median market time against 42. New contracts were steady at 51, up 2.0%. The big change was supply. 108 new listings came on in September, up 66.2% from a year ago. Active inventory ended the month at 152, up 2.7%, with 2.60 months of supply. Homes sold at 98.4% of final list price but 96.0% of original list, one of the wider gaps in the report, so some sellers did have to cut.
| Price band | September 2025 sold | September 2026 sold | Change |
|---|---|---|---|
| $160K – $180K | 1 | 1 | 0% |
| $180K – $200K | 2 | 1 | −50% |
| $200K – $250K | 14 | 10 | −29% |
| $250K – $300K | 11 | 7 | −36% |
| $300K – $400K | 12 | 21 | +75% |
| $400K – $500K | 9 | 6 | −33% |
| $500K – $600K | 6 | 3 | −50% |
| $600K – $700K | 2 | 3 | +50% |
| $700K – $800K | 1 | 0 | −100% |
| $1M – $1.5M | 1 | 0 | −100% |
Source: Southern Missouri Regional MLS via Flexmls, September 2026 vs. September 2025, residential closed sales with a reported sale price, Nixa (Christian County), MO.
The year’s strongest price growth
The September median of $315,000 was up 3.3% from a year ago, but the bigger story is the full year. Nixa’s year-to-date median is $339,782, up 9.6% from $310,000 in 2025. That is the largest year-to-date gain of the eight cities in this report. The $300K to $400K band was the busiest in September with 21 sales, up from 12 a year ago, while sales under $300,000 fell.
What buyers should know right now
- Fresh inventory is coming on: 108 new listings in September, against 65 a year ago. Nixa had 164 active listings as of October 2.
- Entry-level homes are scarce: only 25 active listings were priced under $300,000. Most of the new supply is in the mid and upper ranges.
- The gap between 98.4% of final list and 96.0% of original list says sellers who overprice do come down. Watch for price cuts on homes that have been listed for a few weeks.
- Nixa’s prices have risen faster than anywhere else in the area this year. If you have been waiting for Nixa to get cheaper, the data says it has not.
What sellers should know right now
- You have more competition than a month ago. 108 new listings came on in September, far more than the 65 a year earlier.
- Well-priced homes are moving fast: a median of 23.5 days to contract. If you are not getting showings in the first two weeks, adjust.
- Year-to-date prices are up 9.6%, the strongest gain in the area, but price against recent closed sales, not the year-to-date headline.
- Sellers averaged 96.0% of their original asking price. The sellers who gave up the most were the ones who started too high.
Year-to-date trends (Jan–Sep 2026 vs. 2025)
Nixa prices are up more than anywhere else in the area this year, but new listings just jumped. Find out where your home stands with a real, agent-reviewed valuation.
Or call Zac directly at 417-413-4305 for a 10-minute market conversation.
What this means for the rest of 2026
Nixa’s year to date shows 515 closings, down 4.8% from 2025, with 564 new contracts against 582. Fewer closings at higher prices is a sign of limited supply, and September’s jump in new listings may start to ease that. If the new inventory keeps coming while rates stay above 7%, expect price growth to slow and more sellers to negotiate this fall.
The bigger picture
Nixa has been the area’s price leader in 2026. The year-to-date median is up 9.6%, and homes are selling faster than last year. September added a twist: a large jump in new listings. Whether that becomes a trend or a one-month spike will decide whether Nixa stays a strong seller’s market into winter.
Nixa real estate: frequently asked questions
Is now a good time to buy a home in Nixa, MO?
Nixa saw 108 new listings in September 2026, up 66.2% from a year ago, giving buyers more choice. Active inventory was 152 with 2.60 months of supply. Homes under $300,000 remain scarce, with only 25 active listings in that range as of October 2.
Are home prices going up or down in Nixa, MO?
Nixa’s median sale price was $315,000 in September 2026, up 3.3% from a year ago. The year-to-date median is $339,782, up 9.6% from 2025, the largest gain of the eight Springfield-area cities in our report.
How fast do homes sell in Nixa, MO?
The median Nixa home that sold in September 2026 went under contract in 23.5 days of cumulative market time, down from 42 a year earlier. Year to date the median is 26 days.
How much does a home cost in Nixa, MO?
Nixa homes sold at a median of $315,000 in September 2026. The year-to-date median is $339,782, and the median active listing was priced at $411,250 as of October 2.
Figures reflect residential sales in Nixa (Christian County), MO for September 2026 compared with September 2025, pulled from the Southern Missouri Regional MLS via Flexmls on October 2, 2026. Sold counts, prices and price bands use closed sales with a reported sale price. Days on market is the median CDOM (cumulative days on market). Active inventory, pending sales, new listings, sale-to-list ratios and absorption are the MLS monthly statistics. Year-to-date figures cover January through September. Prior-month figures can shift slightly as late sales are recorded. Market data is provided for general information and is not a guarantee of future results or a substitute for professional or financial advice.