
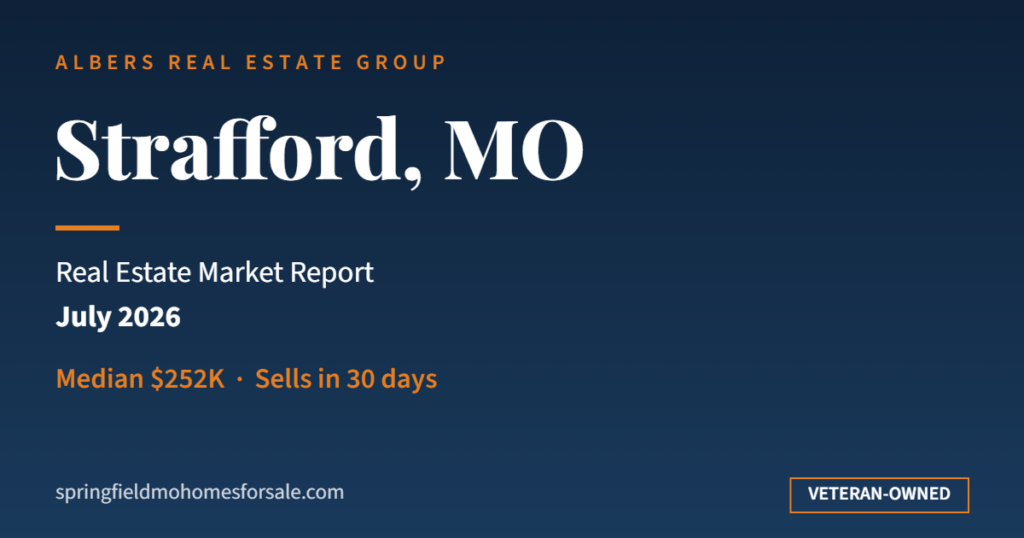
Strafford closed 14 homes in July 2026, up from 5 last July. Pending sales jumped to 16 from 5. Active inventory rose 25% to 30 listings. But the median sale price fell 22.6% to $251,500, and the average dropped 26.9%.
Big percentage swings in a small market need context, so here is what actually happened.
Absorption rate: 4.24 months. Strafford is at 4.24 months of supply — still a seller’s market, but the loosest of the eight cities here. Homes went under contract in a 30-day median and sold at 97.1% of list price. More inventory and more sales at the same time is a market that is simply busier than last year.
Sales tripled and pendings more than tripled — on a very small base
A 180% sales increase sounds explosive, but it is 14 homes versus 5 — and last July was an unusually quiet month for comparison. The more meaningful read is that Strafford had a normal, active summer month while last year’s was thin. The price drop has the same explanation in reverse: the busiest band this July was $200K–$250K with 5 sales, and the mix skewed toward more affordable homes. When more moderately priced homes sell, the citywide median falls even though nothing lost value. Supporting that: homes sold at 97.1% of list price, and the 16 pending sales heading into August are the strongest forward signal Strafford has posted this year.
| Price band | July 2025 sold | July 2026 sold | Change |
|---|---|---|---|
| Under $50K | 0 | 1 | N/A |
| $160K – $180K | 0 | 1 | N/A |
| $200K – $250K | 0 | 5 | N/A |
| $250K – $300K | 2 | 2 | 0% |
| $300K – $400K | 1 | 1 | 0% |
| $400K – $500K | 1 | 1 | 0% |
| $500K – $600K | 0 | 2 | N/A |
| $700K – $800K | 0 | 1 | N/A |
| $800K – $900K | 1 | 0 | −100% |
Source: regional MLS, July 2026 vs. July 2025, residential sold listings, Strafford (Greene County), MO.
What buyers should know right now
- Strafford has more inventory than last summer — 30 active listings, up 25%. That is genuinely more choice in a town this size.
- At 4.24 months of supply and a 30-day median, Strafford gives buyers more room to evaluate than Nixa or Springfield.
- The falling median reflects more affordable homes selling, not distressed sellers. At 97.1% of list, there is modest negotiating room.
- Strafford is USDA-eligible in much of the surrounding area — zero down for qualified buyers is a real option here.
What sellers should know right now
- Buyer activity surged: 14 closings and 16 pendings versus 5 and 5 last July. Demand is dramatically stronger than a year ago.
- Inventory also rose 25%, so you have more competition than last summer. Pricing and presentation matter.
- The citywide median fell because more affordable homes sold, not because values dropped. Price against your own band.
- At 30 days median and 97.1% of list, Strafford is the most negotiable of the metro’s small towns. Build that into your expectations.
Year-to-date trends (Jan–Jul 2026 vs. 2025)
Strafford’s monthly numbers describe the whole city — not your street, your condition, or your finish level. Get a real, agent-reviewed valuation, not a Zillow estimate.
Or call Zac directly at 417-413-4305 for a 10-minute market conversation.
What this means for the rest of 2026
The 16 pending sales are the number to watch — that is more than Strafford’s entire active inventory turnover rate would suggest, and it points to a strong August. If pendings hold at this level while inventory stabilizes, expect the median to recover as the sales mix normalizes.
The bigger picture
Year to date, Strafford’s median sits at $267,000, down about 18% from last year’s pace — but with 2026 volume running well ahead, this is a market finding a broader, more affordable base rather than losing value. Strafford offers small-town living with a short I-44 run into Springfield. The dramatic percentage swings are a function of size: when a town sells 5 to 15 homes a month, every number moves in double digits. Pendings and inventory tell the real story.
Strafford real estate: frequently asked questions
Is now a good time to buy a home in Strafford, MO?
In July 2026, Strafford had 30 active listings and an absorption rate of 4.2 months of supply — a seller’s market. The typical home went under contract in 30 days, compared with 18 days in July 2025. Homes sold for about 97% of list price, so there is some room to negotiate below asking on well-priced homes.
Are home prices going up or down in Strafford, MO?
The median sale price in Strafford was $251,500 in July 2026, −22.6% compared with July 2025. Year to date, the median is $267,000, −17.9% versus the same period in 2025. Keep in mind that a monthly median reflects which homes happened to sell that month as much as it reflects changing values — the year-to-date figure is the steadier number.
How fast do homes sell in Strafford, MO?
The median home in Strafford went under contract in 30 days in July 2026 (cumulative days on market), versus 18 days a year earlier. There were 16 pending sales during the month, +220% from July 2025. Well-priced, move-in-ready homes move fastest; overpriced listings sit regardless of the market.
How much does a home cost in Strafford, MO?
Strafford homes sold at a median of $251,500 and an average of $315,314 in July 2026. The busiest price band was $200K to $250K, with 5 sales that month. Active inventory ranged across 9 price bands, so what you can buy depends heavily on which part of the market you shop.
Figures reflect residential for-sale activity in Strafford (Greene County), MO for July 2026 compared with July 2025, based on regional MLS summary data downloaded August 4, 2026. Counts are taken from MLS price-band totals. Days on market is reported as median CDOM (cumulative days on market). Market data is provided for general information and is not a guarantee of future results or a substitute for professional or financial advice.